import plotly.graph_objects as go
import plotly.io as pio

pio.renderers.default = "plotly_mimetype+notebook_connected"

# Define node and link data
labels: list[str] = ["A", "B", "X", "Y", "Z"]
source_indices: list[int] = [
    0,
    0,
    0,
    1,
    1,
    1,
]  # A -> X, A -> Y, A -> Z, B -> X, B -> Y, B -> Z
target_indices: list[int] = [2, 3, 4, 2, 3, 4]  # X, Y, Z
values: list[int] = [5, 7, 6, 2, 9, 4]  # Weights for each link

# Define colors
color_dict: dict[str, str] = {
    "A": "rgba(252,65,94,0.7)",
    "B": "rgba(255,162,0,0.7)",
    "X": "rgba(55,178,255,0.7)",
    "Y": "rgba(200,200,200,0.7)",
    "Z": "rgba(200,200,200,0.7)",
}

color_dict_link: dict[str, str] = {
    "A": "rgba(252,65,94,0.4)",
    "B": "rgba(255,162,0,0.4)",
    "X": "rgba(55,178,255,0.4)",
    "Y": "rgba(200,200,200,0.4)",
    "Z": "rgba(200,200,200,0.4)",
}

# Create node color list
node_colors: list[str] = [color_dict[label] for label in labels]

# Create link color list based on source nodes
link_colors: list[str] = [
    (
        color_dict_link["A"]
        if source == 0
        else color_dict_link["B"]
        if source == 1
        else color_dict_link["X"]
    )
    for source in source_indices
]

# Create Sankey diagram
fig = go.Figure(
    data=[
        go.Sankey(
            node={
                "pad": 15,
                "thickness": 20,
                "line": {"color": "black", "width": 0.5},
                "label": labels,
                "color": node_colors,
            },
            link={
                "source": source_indices,
                "target": target_indices,
                "value": values,
                "color": link_colors,
            },
        )
    ]
)

# Update layout
fig.update_layout(
    title_text="Sankey Diagram with Custom Colors for A and B",
    font_size=10,
    width=600,
    height=400,
)

# Show diagram
fig.show()파이썬으로 Sankey diagram그리기
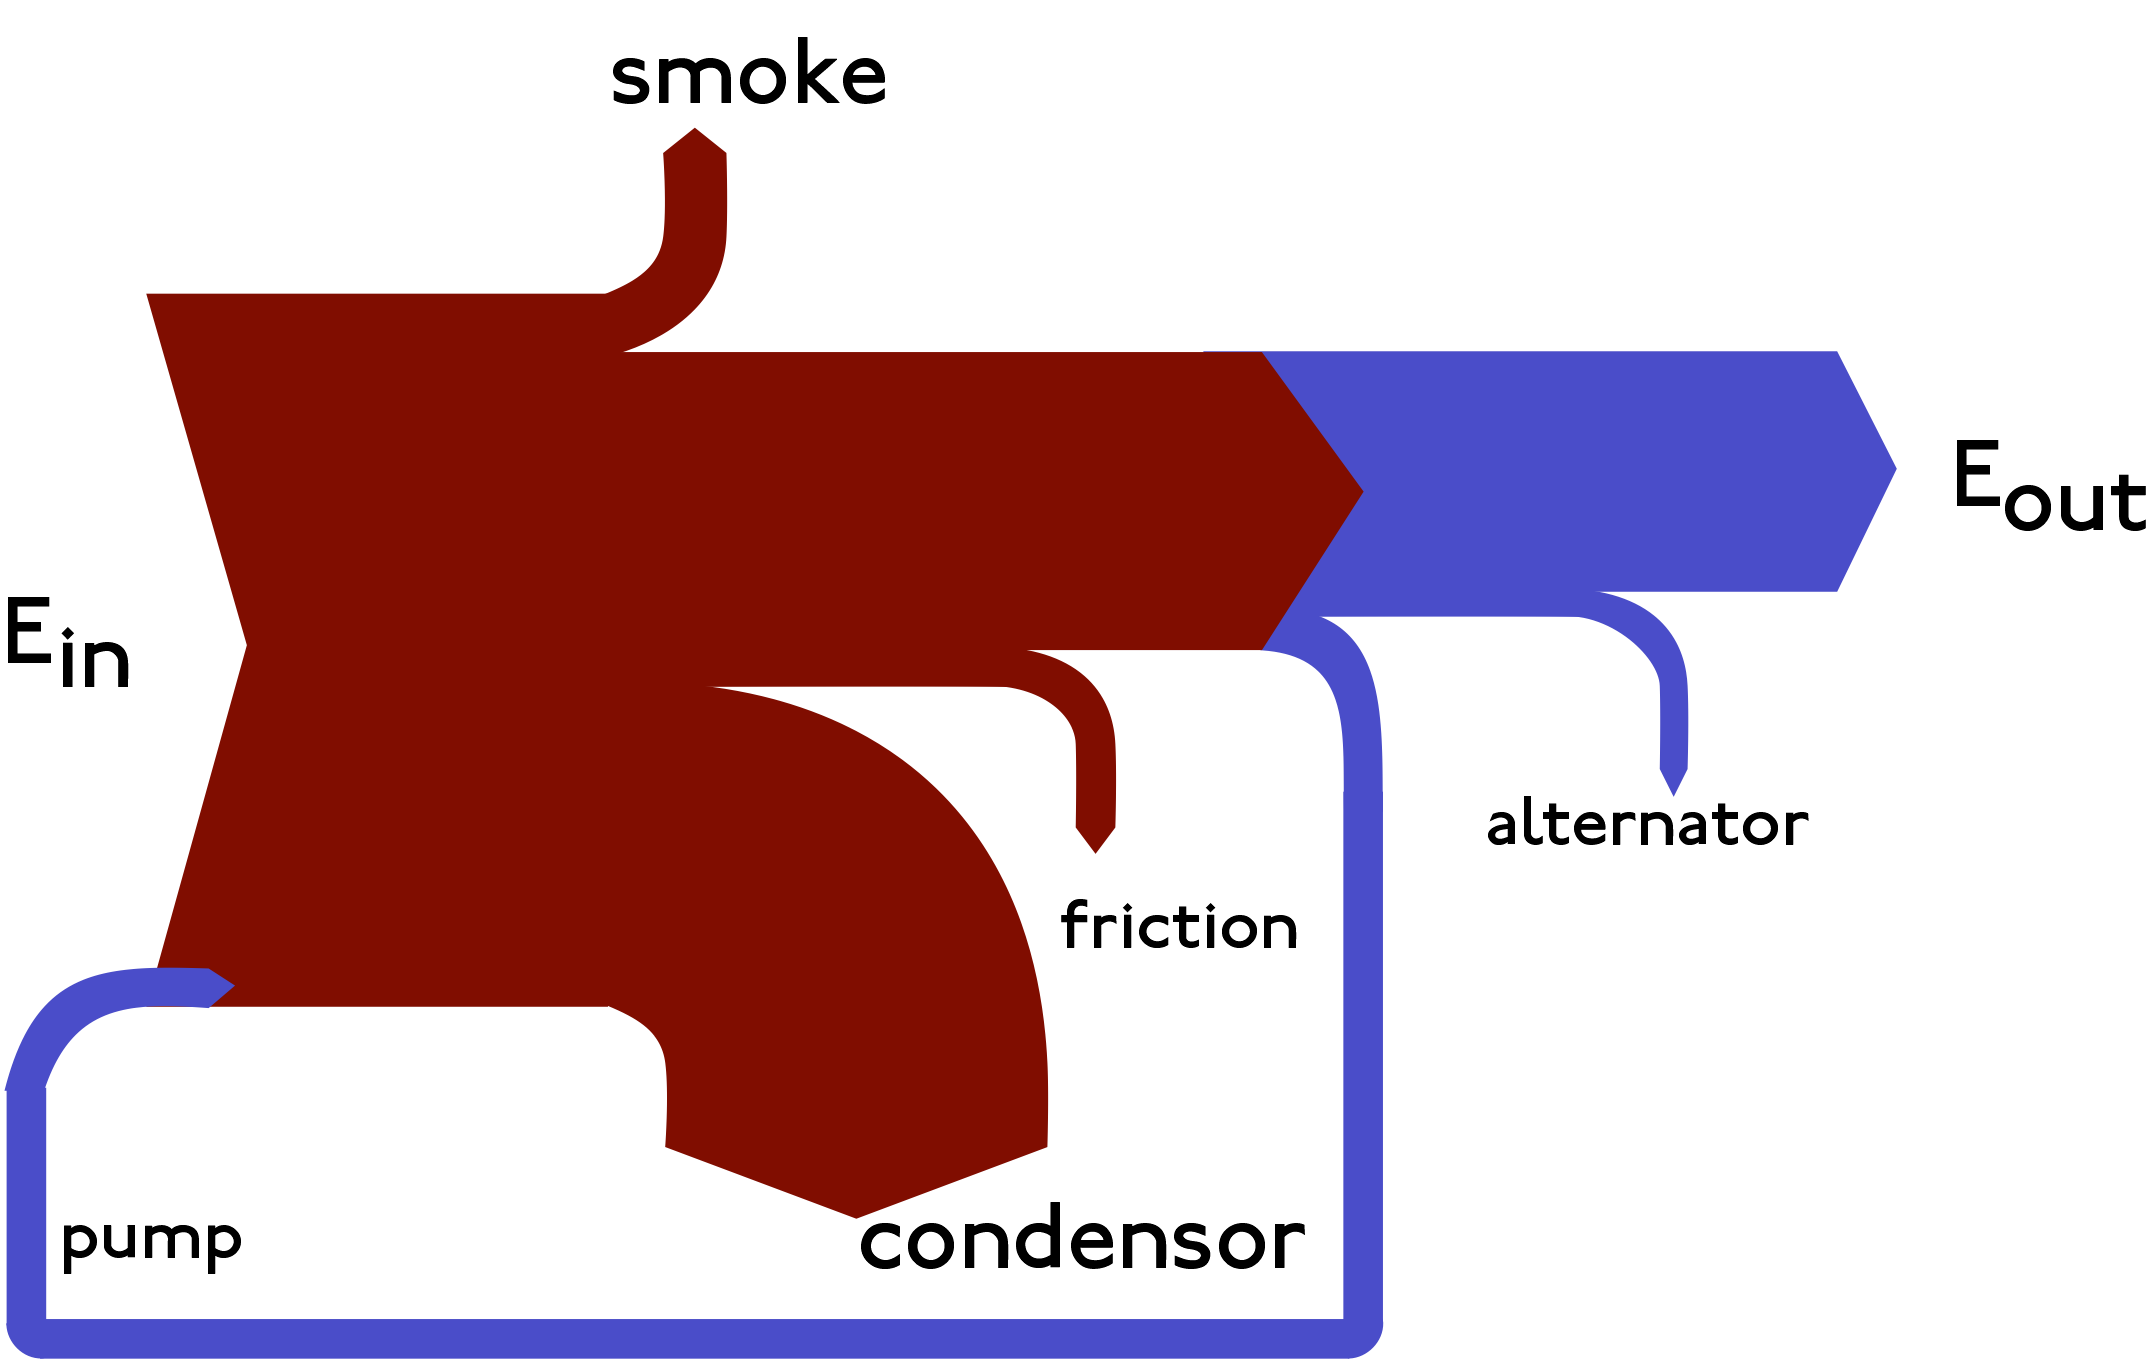
Sankey 다이어그램은 한 값 집합에서 다른 값 집합으로의 흐름을 시각화하는 도구로 열 손실에 비례하는 너비를 가진 화살표를 사용하여 증기 엔진 효율을 시각화했던 Sankey 선장의 이름을 따서 명명되었습니다. Sankey 다이어그램은 서로 다른 고객 세그먼트 간의 전환이나 흐름을 보여주는 데 효과적이며 노드(연결되는 항목)와 링크(연결)로 구성됩니다.
Sankey 다이어그램은 두 도메인 간의 다대다 매핑이나 여러 경로를 통해 트래픽이 이동하는 방식을 나타내는 데 유용합니다. 예를 들어, 대학과 전공 간의 관계를 시각화하거나 웹사이트 내에서 페이지 간의 트래픽 흐름을 보여줄 수 있습니다.
1 기본 Sankey 다이어그램 그리기
간단한 Sankey 다이어그램을 구현하는 방법을 이해하기 위해 Plotly를 사용해 기본적인 다이어그램을 만들어 보겠습니다. Plotly에서 Sankey 다이어그램은 세 개의 리스트로 정의됩니다. 세 가지 리스트는 source(출발점), target(도착점), values(값)입니다. Plotly는 각 노드를 0부터 시작하여 전체 노드 수에서 1을 뺀 숫자까지 인덱싱합니다. source와 target 리스트는 노드 간의 연결을 정의합니다. 아래 코드를 살펴보면 이해하기 더 쉬울 것입니다.
2 고급 Sankey 다이어그램 그리기
Sankey 다이어그램을 위해서는 먼저 데이터를 전처리하는 것부터 시작해야 합니다. 아래는 pandas를 사용해 데이터를 불러오고 노드와 링크 데이터를 만들고 시각화하는 코드입니다.
import pandas as pd

df = pd.read_csv("../../input/estimated-us-energy-cons.csv")
df.head()
# 노드 및 링크 데이터 준비
# 고유한 'to' 노드를 포함하여 모든 노드를 정의합니다.
to_nodes = df["Sankey demo series (to)"].unique().tolist()
labels = df["Sankey demo series (from)"].tolist() + to_nodes
# 출발 노드 인덱스 (source)
source_indices = df["Sankey demo series (from)"].map(lambda x: labels.index(x)).tolist()
# 도착 노드 인덱스 (target)
target_indices = [labels.index(to_node) for to_node in df["Sankey demo series (to)"]]
# 링크의 가중치
values = df["Sankey demo series (weight)"].tolist()
# 색상 정의
color_dict = {
"Net Import": "rgba(252,65,94,0.7)", # Red
"Solar": "rgba(255,162,0,0.7)", # Orange
"Nuclear": "rgba(55,178,255,0.7)", # Light Blue
"Hydro": "rgba(0,128,0,0.7)", # Green
"Wind": "rgba(75,0,130,0.7)", # Indigo
"Geothermal": "rgba(255,105,180,0.7)", # Hot Pink
"Natural Gas": "rgba(255,215,0,0.7)", # Gold
"Coal": "rgba(105,105,105,0.7)", # Dim Gray
"Biomass": "rgba(139,69,19,0.7)", # Saddle Brown
"Petroleum": "rgba(173,216,230,0.7)", # Pastel Blue
"Electricity & Heat": "rgba(200,200,200,0.7)", # Gray for target node
"Residential": "rgba(173,216,230,0.7)", # Light Blue for Residential
"Commercial": "rgba(144,238,144,0.7)", # Light Green for Commercial
"Industrial": "rgba(255,182,193,0.7)", # Light Pink for Industrial
"Transportation": "rgba(255,140,0,0.7)", # Dark Orange for Transportation
}
# 노드 색상 리스트 생성
node_colors = [color_dict.get(label, "rgba(200,200,200,0.7)") for label in labels]
# 링크 색상 리스트 생성 (출발 노드에 따라 색상 결정)
link_colors = [color_dict[df["Sankey demo series (from)"].iloc[i]] for i in range(len(df))]
# Sankey 다이어그램 생성
fig = go.Figure(
data=[
go.Sankey(
node={
"pad": 15,
"thickness": 20,
"line": {"color": "black", "width": 0.5},
"label": labels,
"color": node_colors,
},
link={
"source": source_indices,
"target": target_indices,
"value": values,
"color": link_colors, # 링크 색상 적용
},
)
]
)
# 레이아웃 업데이트
fig.update_layout(
title_text="Sankey Diagram for Energy Sources",
font_size=10,
width=600,
height=500,
)
# 다이어그램 표시
fig.show()3 마치며
Sankey 다이어그램은 데이터 분석과 시각화에 있어 매우 유용한 도구입니다. 고객 세그먼트 간 전환, 웹사이트 트래픽 흐름, 에너지 소비 등 다양한 분야에서 활용될 수 있습니다. Python과 Plotly를 사용하면 복잡한 데이터셋도 쉽게 Sankey 다이어그램으로 표현할 수 있어, 데이터 기반의 의사결정과 인사이트 도출에 큰 도움이 될 것입니다. Sankey 다이어그램의 구현 방법을 익히고 실제 데이터에 적용해 보면서, 여러분의 데이터 시각화 스킬을 한 단계 더 발전시켜 보시기 바랍니다.


