# example Data
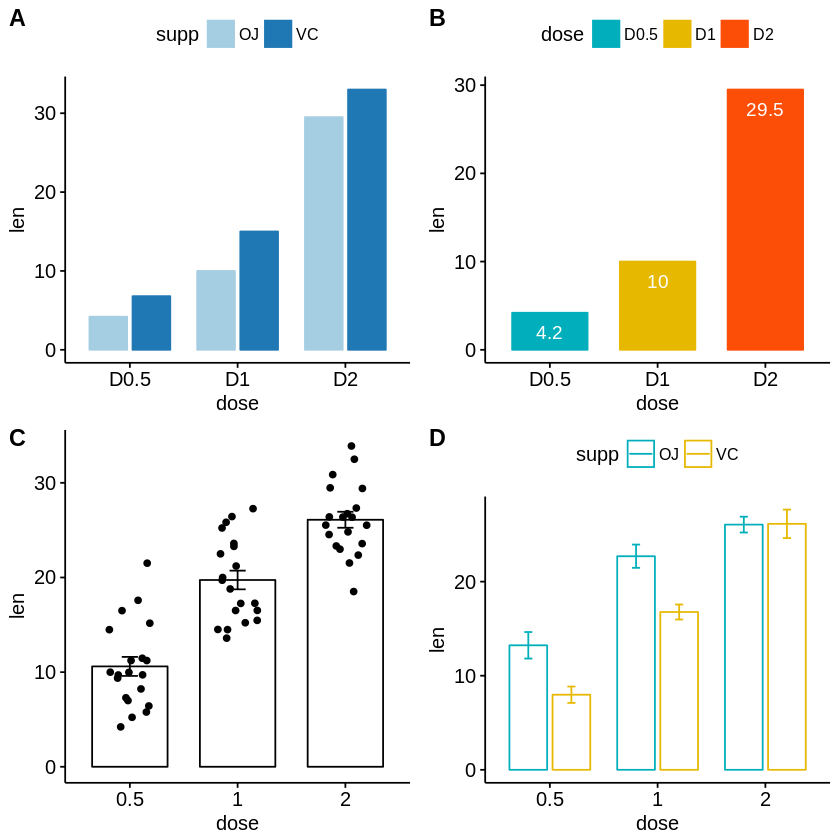
df <- data.frame(dose=c("D0.5", "D1", "D2"),
len=c(4.2, 10, 29.5))
df2 <- data.frame(supp=rep(c("VC", "OJ"), each=3),
dose=rep(c("D0.5", "D1", "D2"),2),
len=c(6.8, 15, 33, 4.2, 10, 29.5))
df3 <- ToothGrowth
# Change position: Interleaved (dodged) bar plot
p1 <- ggbarplot(df2, "dose", "len",
fill = "supp", color = "supp", palette = "Paired",
position = position_dodge(0.8))
# Change fill and outline color add labels inside bars
p2 <- ggbarplot(df, "dose", "len",
fill = "dose", color = "dose",
palette = c("#00AFBB", "#E7B800", "#FC4E07"),
label = TRUE, lab.pos = "in", lab.col = "white")
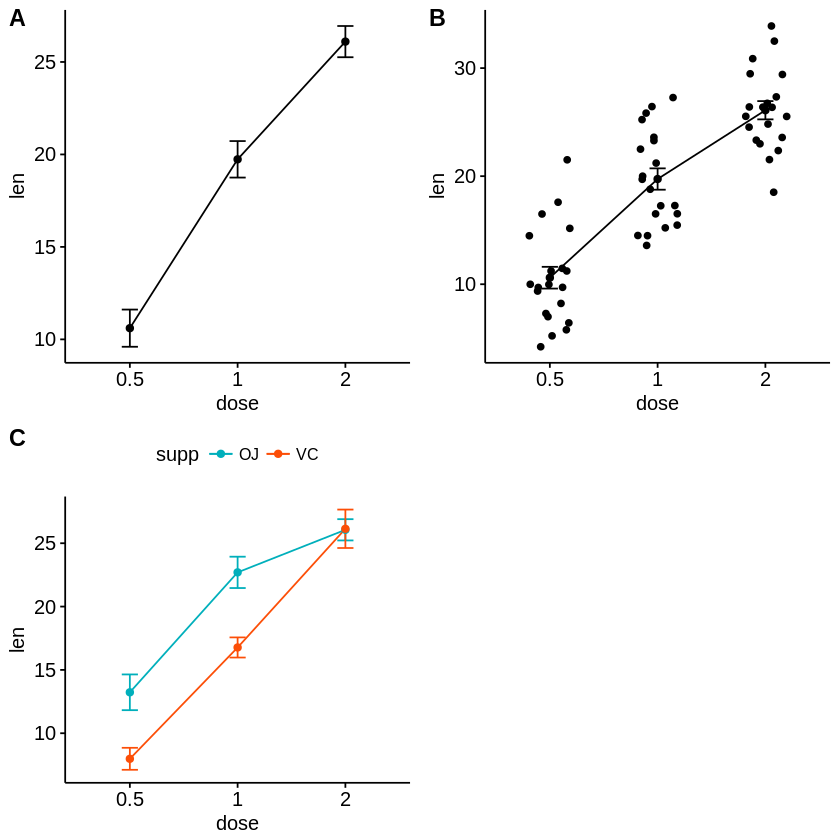
# Add jitter points and errors (mean_se)
p3 <- ggbarplot(df3, x = "dose", y = "len",
add = c("mean_se", "jitter"))
# Multiple groups with error bars and jitter point
p4 <- ggbarplot(df3, x = "dose", y = "len", color = "supp",
add = "mean_se", palette = c("#00AFBB", "#E7B800"),
position = position_dodge(0.8))
ggarrange(p1, p2, p3, p4,
labels = c("A", "B", "C", "D"),
ncol = 2, nrow = 2)